

Quantifying and Optimising Solid-State Battery Electrodes
.png)
Introduction
Solid-state batteries (SSBs) are a promising next-generation technology due to their high energy density, light weight, and safety. Initial commercialization is expected in 2027, with electric vehicles as the primary market and broader adoption occurring in early 2030. However, several challenges remain if SSBs are to be widely adopted, including limited ionic and electrical conductivity, unstable electrode-electrolyte interfaces, lithium dendrite formation, and mechanical degradation. Manufacturing barriers such as producing defect-free solid electrolytes at scale, maintaining reliable interfacial contact, and reducing production costs also limit their performance and large-scale deployment. From manufacturing optimisation, to root cause failure analysis, Polaron’s machine learning tools can unlock critical information about SSB performance and its links to microstructure.
This whitepaper shows how quantitative SEM analysis addresses that gap. Using Polaron’s segmentation and 3D reconstruction workflows, we measure interfacial surface area and transport metrics including tortuosity and connectivity. A case study on vapour-grown carbon fibre (VGCF) loading reveals improved electronic contact and reduced pore-active material interface and a trade-off between electronic efficiency and electrolyte tortuosity. By turning microscopy data into repeatable design metrics, Polaron enables faster formulation screening and reduced reliance on physical experimentation - accelerating development of high-performance solid-state batteries.
Interface engineering is critical in solid-state batteries
The key difference between conventional lithium-ion batteries and solid-state batteries (SSBs) is the replacement of liquid electrolytes with solid electrolyte particles. While materials such as Li₆PS₅Cl (LPSCl) offer excellent ionic conductivity, battery performance depends heavily on how these particles are distributed, packed, and connected within the electrode. In the field of SSBs, interfaces between phases are particularly important. For example:
- Electrolyte - Active Material Interface: Increasing electrolyte - active material contact improves ionic transport and promotes more effective utilization of active material.
- Carbon binder domain (CBD) - Active Material Interface: The conductive binder domain (CBD), in this case a vapour grown carbon fibre (VGCF) additive, provides electronic conductivity throughout the electrode. Increasing VGCF contact enhances electron transport pathways.
- Pore - Active Material Interface: The active material - pore interface should be minimized. Excessive pore contact can indicate poor utilization of active material and the presence of inactive regions within the electrode.
Interfaces also evolve over the lifetime of the cell. Thermal and electrochemical cycling can result in interface degradation and solid-solid delamination - further increasing impedance and reducing performance.
This has several consequences:
- Increased impedance in the system due to inactive surface area.
- Lower energy density as portions of the active material become electrochemically inactive.
- Reduced power density and rate capabilities caused by transport limitations throughout the electrode structure.
In summary, even if a material has excellent intrinsic properties, poor microstructural (interface) design can prevent those properties from being fully realised.

The challenge of measuring interface quality empirically
Assessing interface quality experimentally remains a significant challenge. There is, in fact, no established experimental method that can directly measure the contact interface quality between two phases. This can only be partially inferred from electrochemical test data and resistance measurements, but with significant uncertainty due to the myriad reasons for cell to cell performance variation. Examples of experimental techniques that are used today to attempt to measure infer surface area include:
- Gas adsorption can provide estimates of the exposed surface area of the system (i.e. the solid surfaces exposed to porosity). However, this cannot distinguish between different materials in a composite, or reveal insight into solid-solid interfaces.
- Electrochemical testing can reveal performance differences between formulations, but cell-to-cell variability often makes it difficult to identify the specific microstructural features responsible for improved or degraded performance. Consequently, establishing clear links between electrode architecture and electrochemical behavior requires more direct methods of interface characterisation.
Quantifying interfaces directly from images with Polaron AI
At Polaron, we address this challenge through quantitative microstructural analysis using cross-sectional scanning electron microscopy (SEM). Rather than relying solely on electrochemical performance metrics, we directly measure the interfacial surface area between different phases within the electrode. The workflow to extract interfacial surface areas is simple; add labels to train a segmentation model, one click to reconstruct a representative 3D volume, and another to run an analysis workflow.
The process is repeatable and scalable, making it appropriate for production quality operations, or high throughput R&D experimental campaigns. There are many advantages to image based methods for interface quantification. First, microstructural data is not limited to a single interfacial area parameter. Instead, complex relationships between particle morphology (size, aspect ratio, location in the electrode) and interfacial surface area can be extracted.
This allows more complex and accurate diagnostics of the root causes of performance variation. Second, data collected by visualisation of interfaces using microscopy techniques is highly verifiable. Unlike experimental approaches, when something goes wrong with image collection (delamination, image artifacts, non-representative data), you can see it and perform repeats.
Finally, using Polaron, a single image can yield a vast amount of information about SSB electrode behaviour beyond the interfacial area. Particle size, morphology, connectivity and tortuosity can all be extracted, streamlining numerous experimental approaches into a single, repeatable workflow. This is at the heart of where AI can have the most impact in battery materials science - not just collecting more data, but getting more out of the data we collect.
Going beyond interfaces to 3D transport metrics
An interface between active material and solid electrolyte does not guarantee a non-isolated particle; the electrolyte must percolate from the particle surface, to the current collector, in order for charge transfer to occur. A simple measure of connectivity can be used to quantify this microstructural feature, given by percolating phase volume fraction divided by total phase volume fraction. These values can be calculated from reconstructed 3D volumes. A higher fidelity measure of percolation is connectivity as a function of distance from the current collector, calculated using the same formula, but slice by slice through the volume.
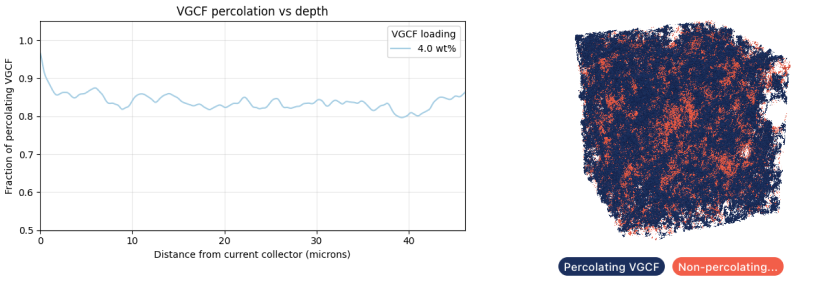
Tortuosity calculations are the final analysis step we will explore in the following case study. Connectivity is a binary measure of whether a region of electrolyte or VGCF percolates, connecting particles to the current collector. Tortuosity, in comparison, gives a measure of how efficient the transport will be through the domain. It is a critical parameter in electrochemical models, and widely used as a transport indicator to compare microstructures.
Case study - investigating the impact of conductive additive loading in SSB
To demonstrate how quantitative microstructural analysis can guide electrode design, we analysed a series of solid-state battery electrodes containing different loadings of VGCF. Cross-sectional SEM images were segmented into four phases: active material, solid electrolyte, VGCF and pore, and reconstructed into representative 3D volumes using Polaron's reconstruction pipeline. From these volumes, the interfacial surface area between every phase pair was calculated.
Download our full white paper
