The Impact of State of Charge on Transport in Silicon Anodes
Introduction
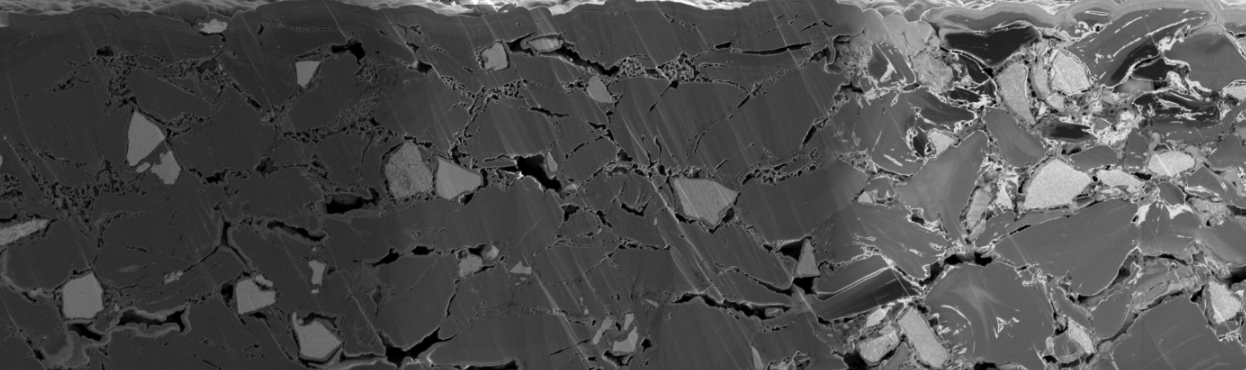
Fast charging in graphite-silicon suboxide (Gr-SiOx) anodes depends on keeping ionic transport efficient as the electrode changes during lithiation. SiOx offers much higher specific capacity than graphite, and it also expands much more. Graphite expands less. The pore network has to absorb both changes without losing the connected paths lithium ions need.
That is a coupled microstructural problem. As the active phases expand, pore space can be consumed, the coating can thicken, and the paths that remain can become more tortuous. Measuring one of those effects on its own gives only part of the picture. Pore fraction says how much void space is left. It does not say whether that space still forms an efficient through-plane network.
The question in this study is where lithiation-driven dimensional change is accommodated in a Gr-SiOx anode, and what that means for transport through the pores.
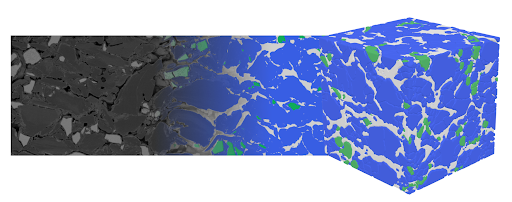
Polaron's segmentation and 3D reconstruction workflows turn the cross-sections teams already collect into those measurements on one dataset. This white paper compares Gr-SiOx electrodes across five states of charge. Two-dimensional segmentations give porosity, coating thickness and SiOx particle size. Reconstructed volumes give pore-network tortuosity. Together they connect the particle, the electrode and the transport path.
From multi-detector SEM to linked measurements
Fifteen cells with an NMC811 cathode and a Gr-SiOx anode were formed, then charged to 0%, 25%, 50%, 75% or 100% state of charge, with three electrodes at each state. The 0% group was charged and then returned to a delithiated state. These are not pristine, uncycled electrodes.
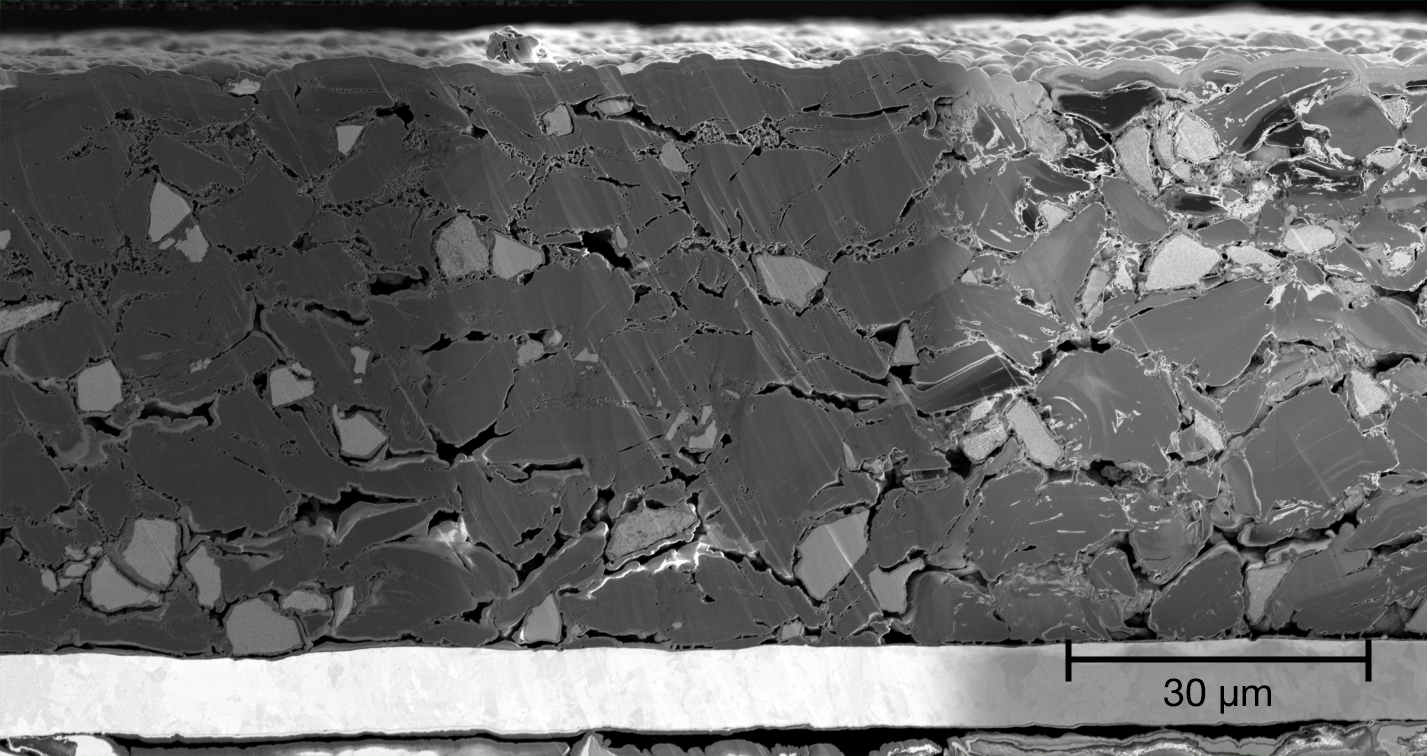
Electrodes were harvested in an inert-atmosphere glovebox, cross-sectioned by broad-beam ion milling, and transferred with an air-protected system. Each state of charge is a different electrode, so the same particles cannot be followed through charge. The comparison depends on statistically representative samples.
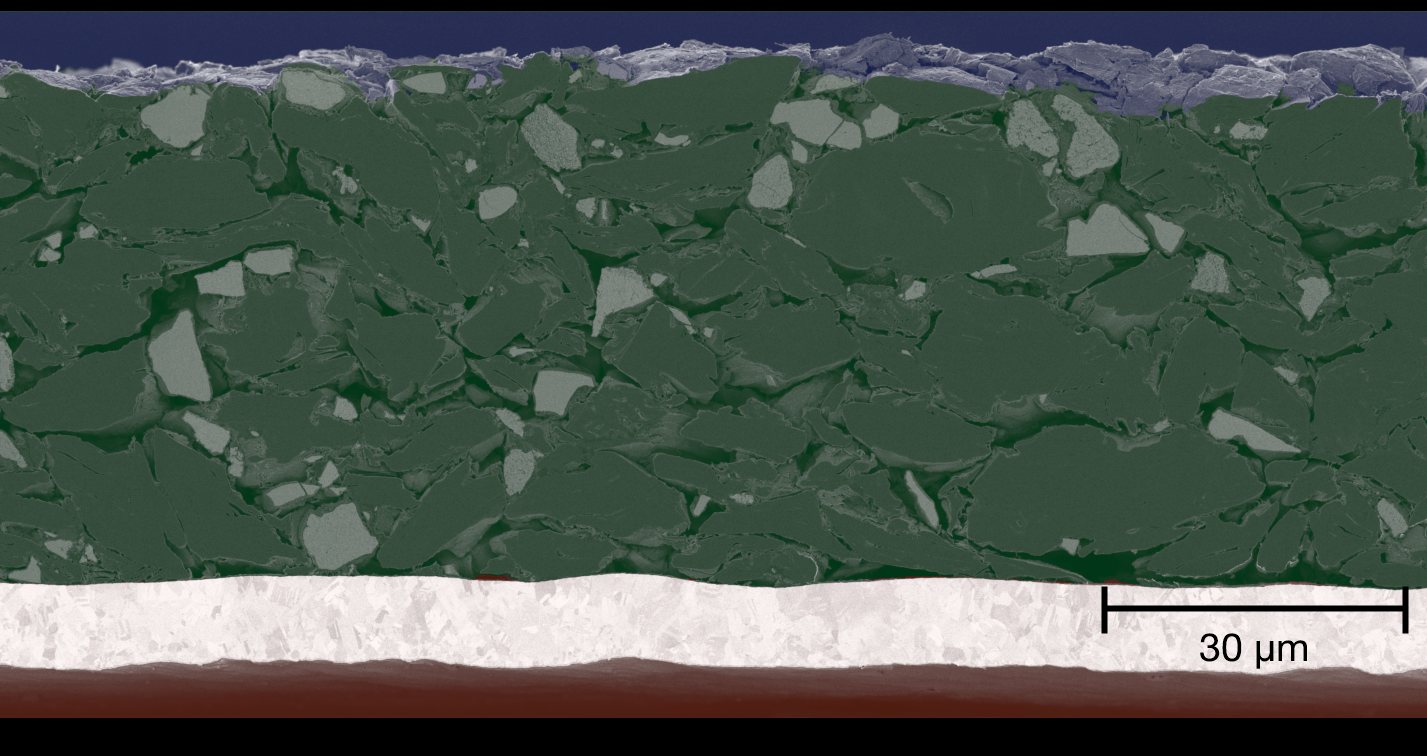
Each image was collected on three detectors at once: backscattered, secondary and in-lens. Polaron stacks those signals so composition and morphology are used together during segmentation. The coating was segmented into SiOx, graphite and pore. The current collector and the background above the electrode were identified separately, so they are not included in the coating measurements.
The analysis follows four questions:
- Phase fractions: How does internal porosity change with state of charge, and which phases balance that change?
- Electrode thickness: Does particle expansion change the coating thickness?
- SiOx particle size: How does lithiation-associated expansion show up in the size distribution?
- Pore tortuosity: How does the remaining pore network change the predicted transport resistance?
Image-based measurements stay visually auditable. Ion milling is destructive, so an exact replacement section is not always available, but the image still shows what produced an unusual result. That complements bulk methods such as X-ray diffraction or impedance, whose signals are harder to assign to one local feature.
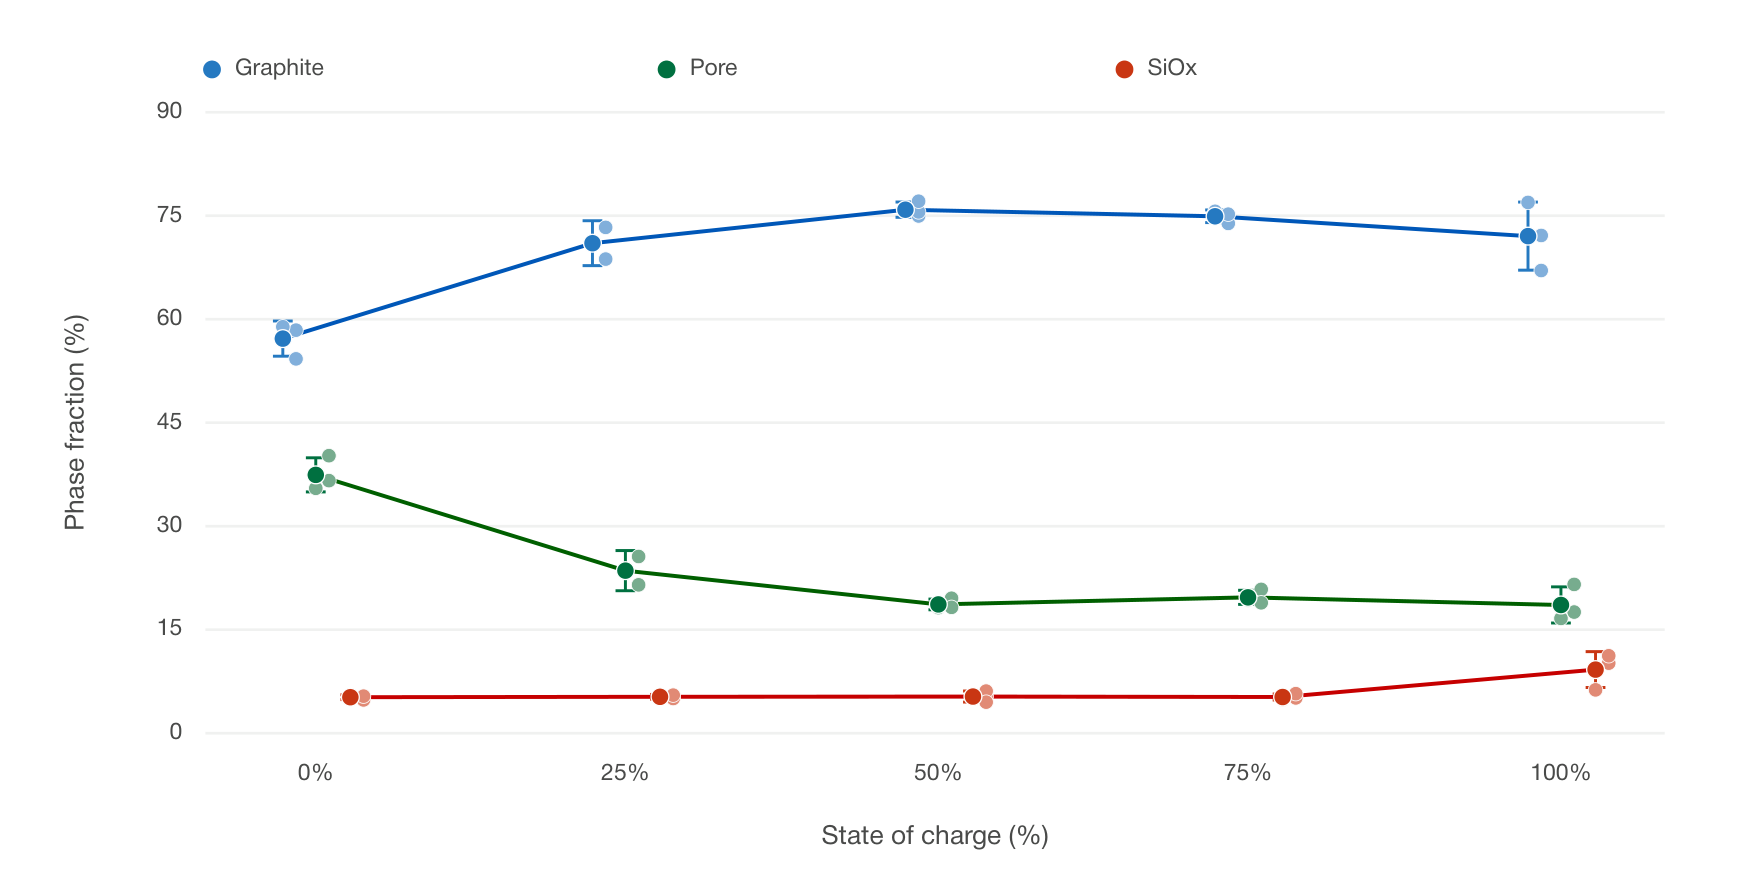
Pore loss is the first large structural change
Mean segmented pore fraction falls from about 0.37 at 0% state of charge to 0.19 at 50%, then stays between 0.17 and 0.19 through to 100%. Most of the porosity change is in the first half of the range. Over that same interval the graphite fraction rises. The mean SiOx fraction stays roughly stable through 75% and is higher in the 100% group. One electrode at 25% showed substantial delamination and was left out of the phase-fraction comparison. The spread at each state of charge is the standard deviation across the independently prepared electrodes.
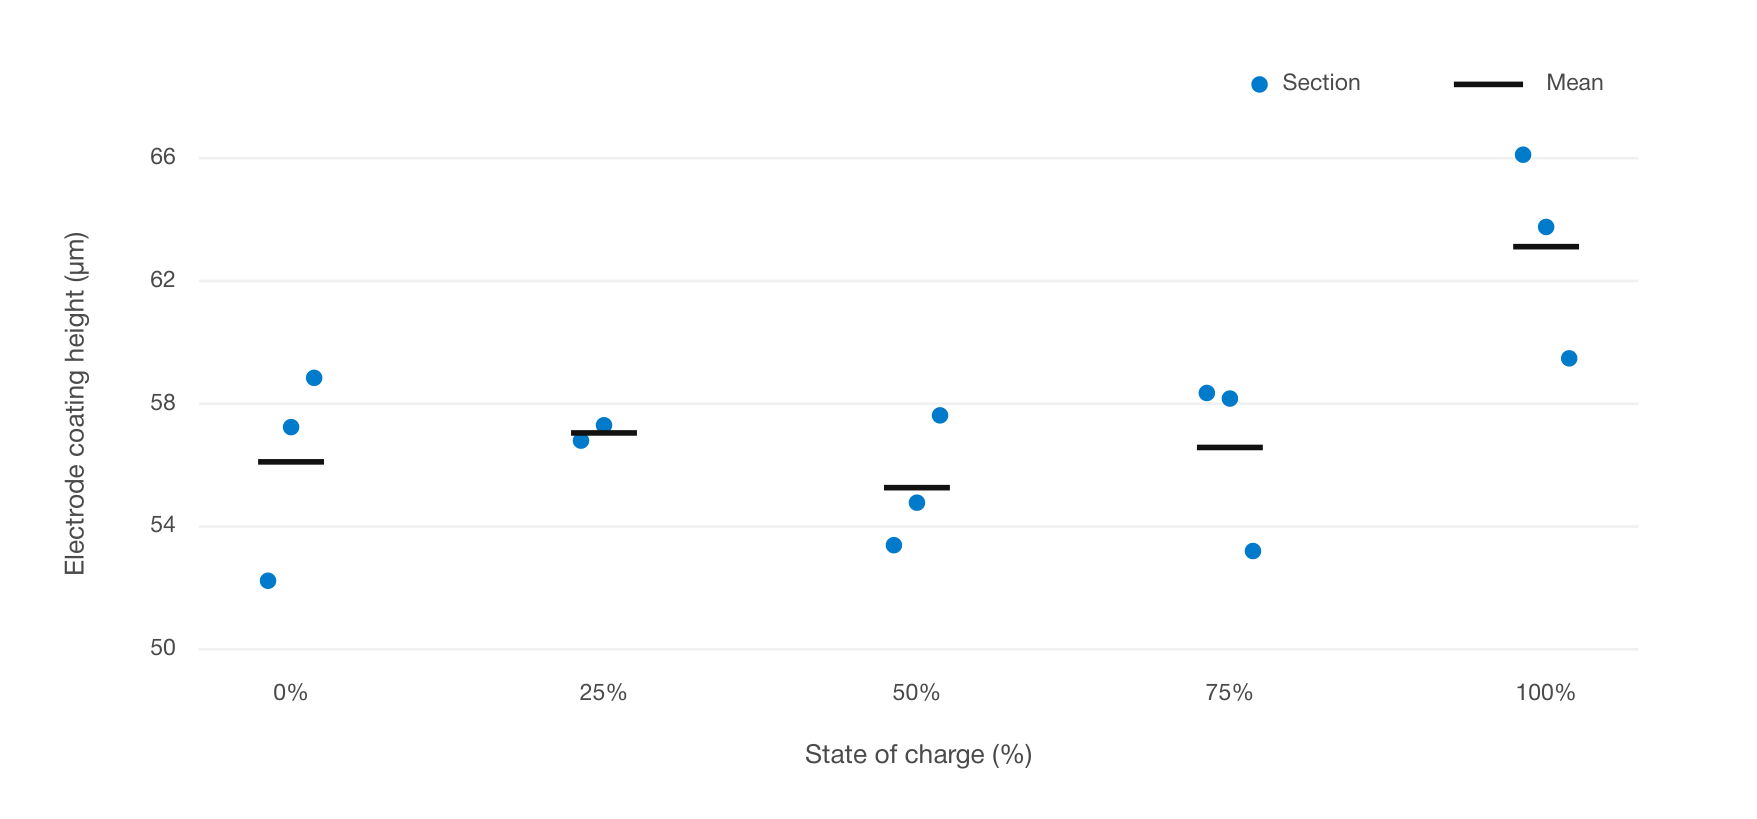
Coating thickness does not follow the same curve. From 0% to 75% the group means are 56.1, 57.1, 55.3 and 56.6 um. At 100% the mean rises to 63.1 um, about 12% above the earlier plateau, and every section in that group is thicker than the sections at lower states of charge. Thickness is measured on the coating only, after the current collector and out-of-plane regions are segmented out.
Read together, the two measurements suggest a two-scale accommodation. At lower states of charge, a large drop in pore fraction arrives without a thicker coating. At 100%, the coating is thicker and the relative pore content has barely moved further. One reading is that dimensional change is taken up inside the pore space first, and becomes visible at the coating scale once that internal room is reduced.
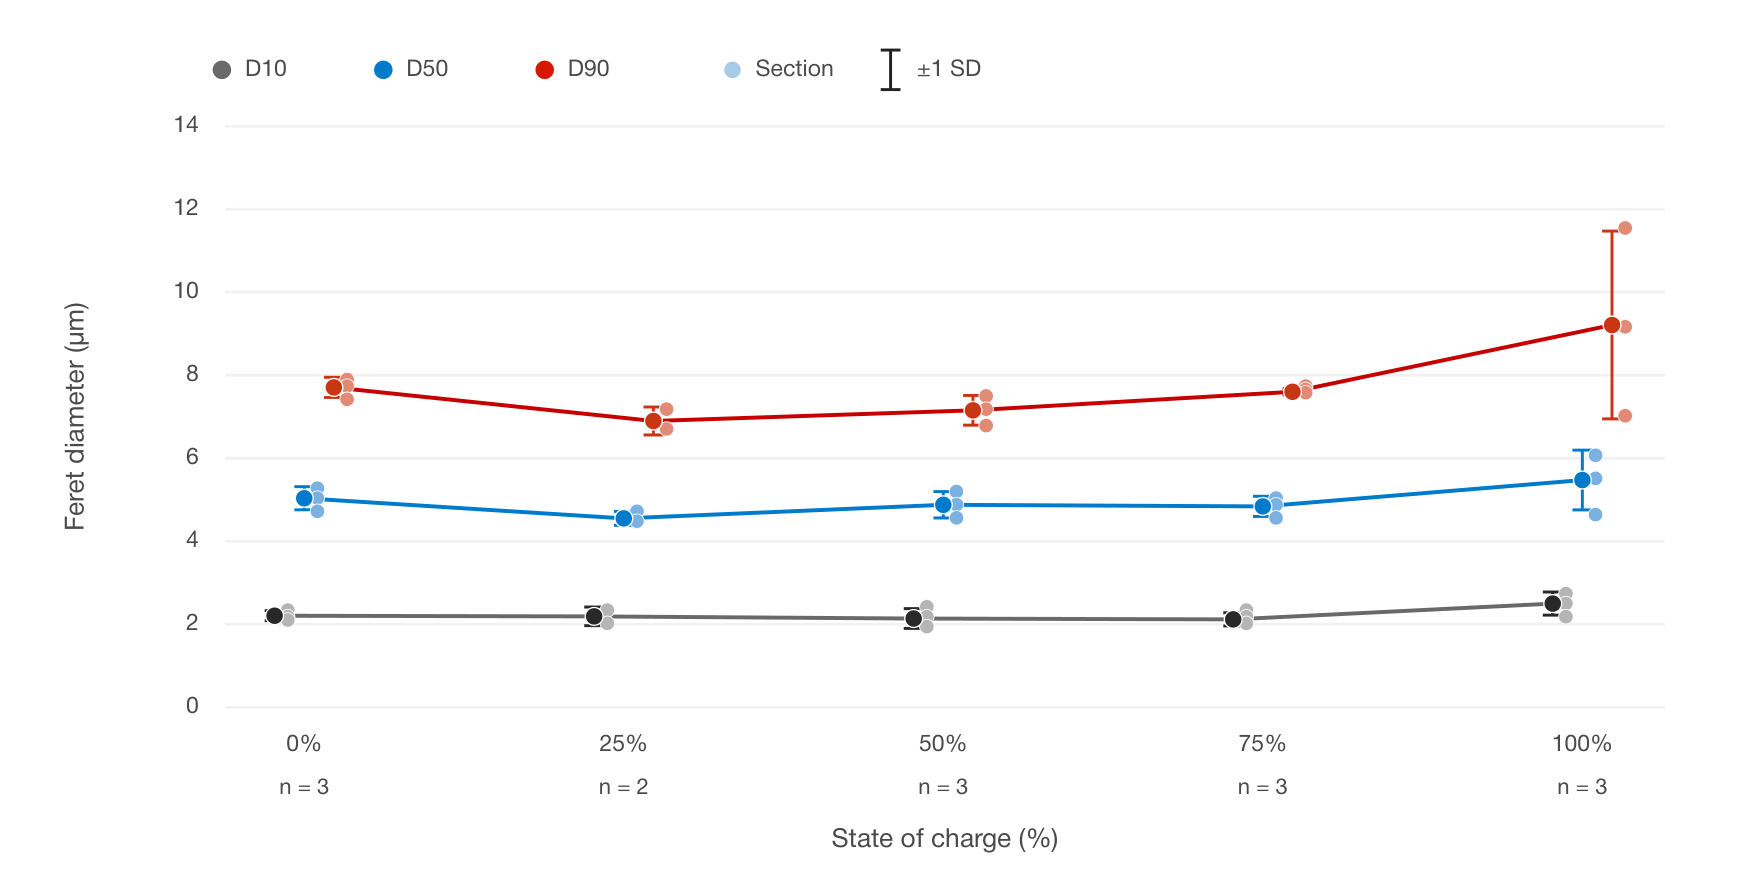
Larger SiOx particles accompany the thicker fully charged coating
SiOx size was measured as an area-weighted Feret diameter. Particles below 0.4 um were excluded as noise. Between 0% and 75% state of charge the distribution barely moves. At 100% the particles are larger. Mean D50 rises from 4.9 um to 5.7 um, about 16%. Mean D90 rises from about 7.4 um to 9.6 um.
Particle size and coating thickness move together. Both stay nearly level from 0% to 75%, then rise at 100%. These are two-dimensional comparisons across different electrodes, not a track of the same particle through charge. The 25% size group is based on two electrodes, after the delaminated sample was excluded. The other states of charge use three.
Polaron extends the same segmentations into statistical 3D volumes. Those volumes are what make a transport metric possible: pore tortuosity, calculated from the network around the particles rather than from a single porosity number.
Tortuosity keeps rising after porosity levels off
Pore fraction describes how much space is available to the electrolyte. It does not describe whether the path through that space is direct. Two electrodes can share a porosity and still differ if one has open, connected pores and the other has narrow, winding or dead-end paths. Tortuosity separates those cases.
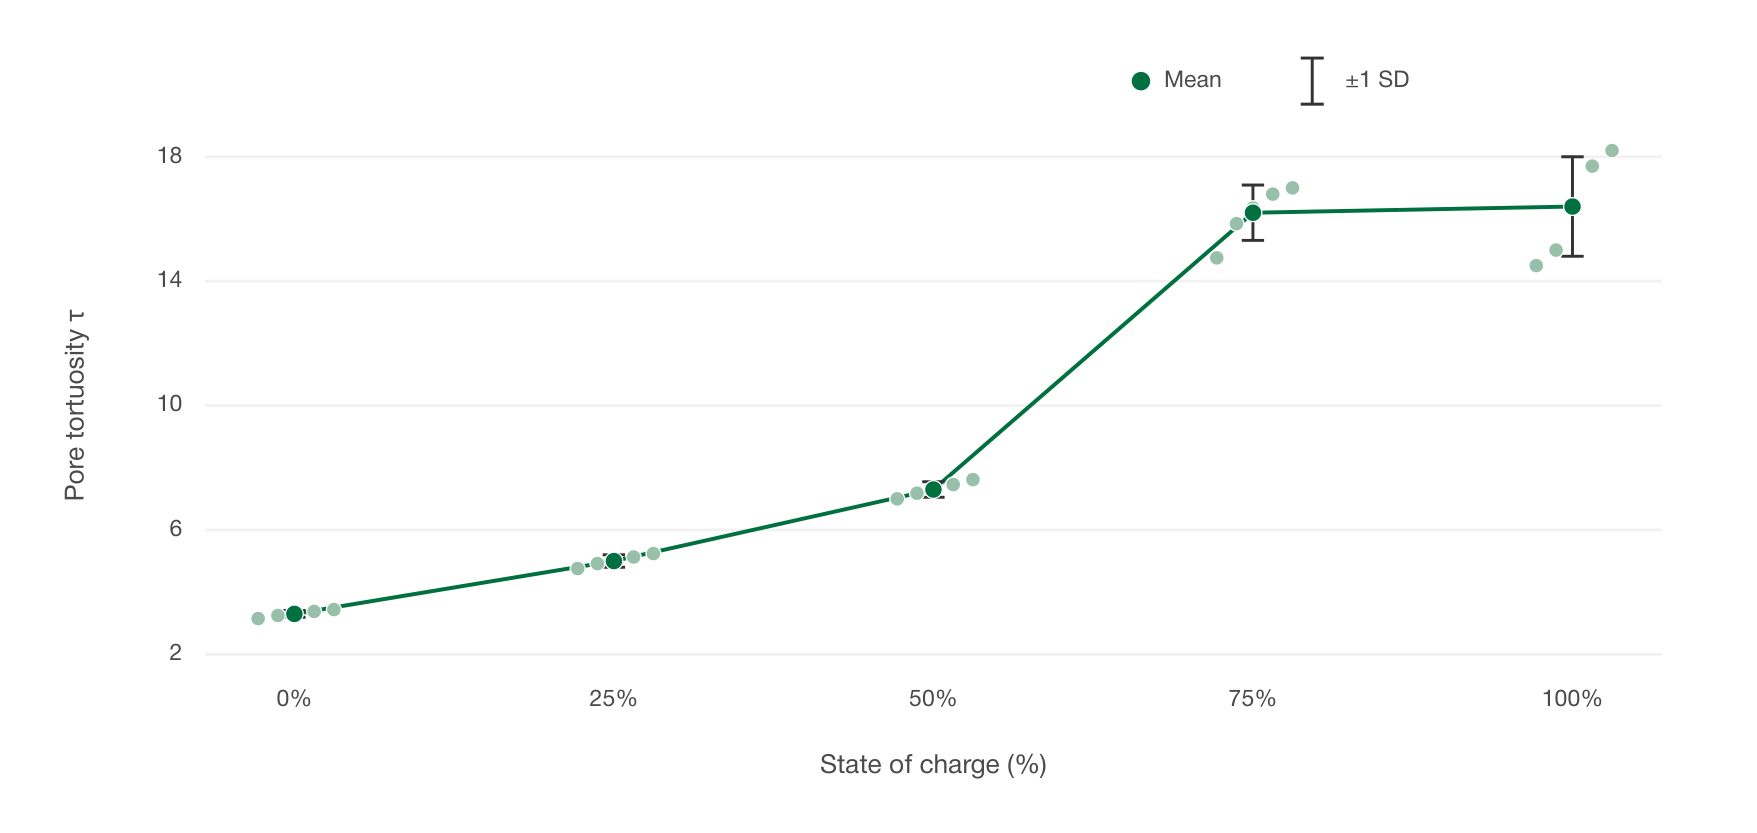
Five reconstructions were generated at each state of charge: 25 cubes in total, each 51.2 um on a side. In every volume the pores form a connected 3D network. Through-plane tortuosity, calculated with TauFactor 2 on the Polaron volumes, rises from 3.3 at 0% to 5.0 at 25%, 7.4 at 50%, 16.1 at 75% and 16.4 at 100%.
Porosity has largely stopped changing by 50% state of charge. Tortuosity has not. It climbs sharply between 50% and 75%, then changes little through to 100%. The remaining pore network exacts a larger transport penalty even while the pore fraction is nearly flat. That penalty is visible in the reconstructed volume. A 2D pore fraction cannot show the path length that sets how ions actually move.
A Bruggeman estimate understates the penalty
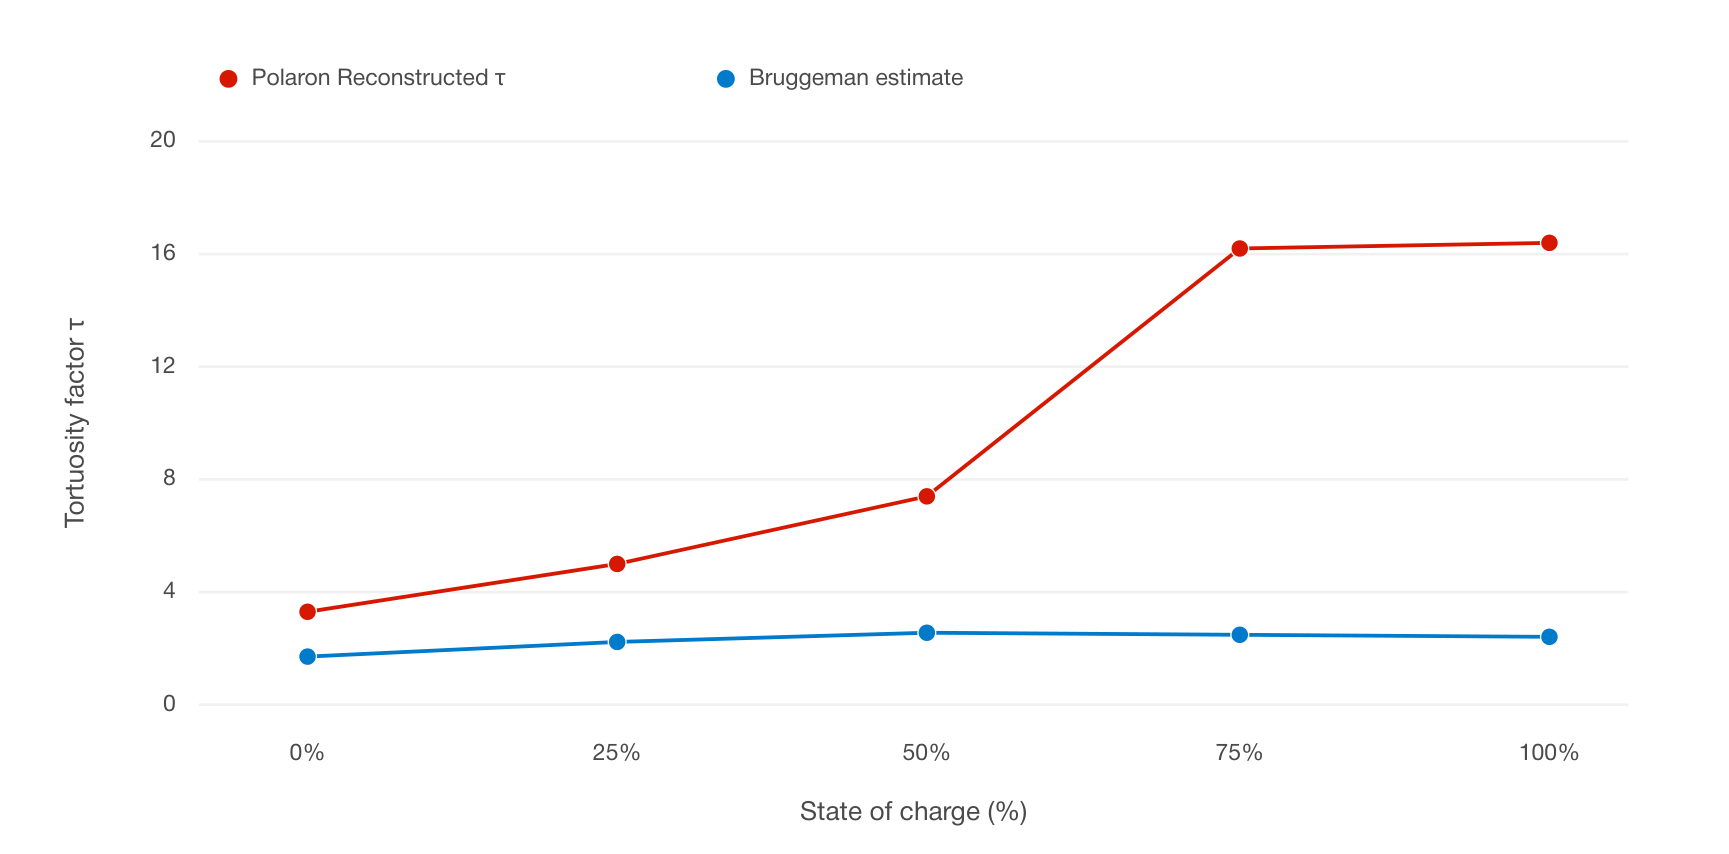
A classical Bruggeman relation is a useful reference. It takes the ratio of effective diffusivity to bulk diffusivity as porosity to the power 1.5. Under the tortuosity convention used here, that is equivalent to a tortuosity of porosity to the power -0.5.
Using the mean 2D pore fractions as the porosity estimate, Bruggeman tortuosities sit at about 1.7-2.6. The reconstructed volumes sit at 3.3-16.4. The gap widens once state of charge passes 50%. The Bruggeman relation underestimates the transport resistance of these electrode structures. That is consistent with the known limits of applying the approximation to real electrode microstructures.
What this means for electrode development
Porosity on its own does not describe pore-phase transport. The three-dimensional shape of the pore network has to be included, and it changes with state of charge.
From the same microscopy data, Polaron links particle size, coating thickness, phase fraction and pore transport. That supports faster comparison of formulations, calendering conditions and processing routes, so fewer candidates need a full build-and-teardown loop. The same analysis can supply electrochemical models with state-of-charge-dependent porosity and tortuosity, in place of values that are often held fixed.
To speak to an engineer at Polaron, contact info@polaron.ai.
Download our full white paper