

Trust in Microstructure Quantification
Introduction
For materials scientists and battery engineers, the Scanning Electron Microscope (SEM) is a fundamental tool for understanding material behaviour. From early-stage R&D to end-of-life failure analysis, SEM micrographs provide the foundation for quantitative microstructural characterisation. In battery manufacturing, high-throughput imaging is routinely used to measure critical properties such as porosity, active material loading, particle size distribution and crack density. These measurements inform electrochemical models, guide process optimisation, and ultimately determine whether a batch meets quality control standards. Automated segmentation is a critical step in this process, and has become increasingly capable. However, in the world of microstructure, the challenge is not simply generating a segmentation mask. The question is whether the measurements derived from that mask can be trusted. How can we quantify confidence in our results, and how do we know when a model is operating on data it has never seen before?
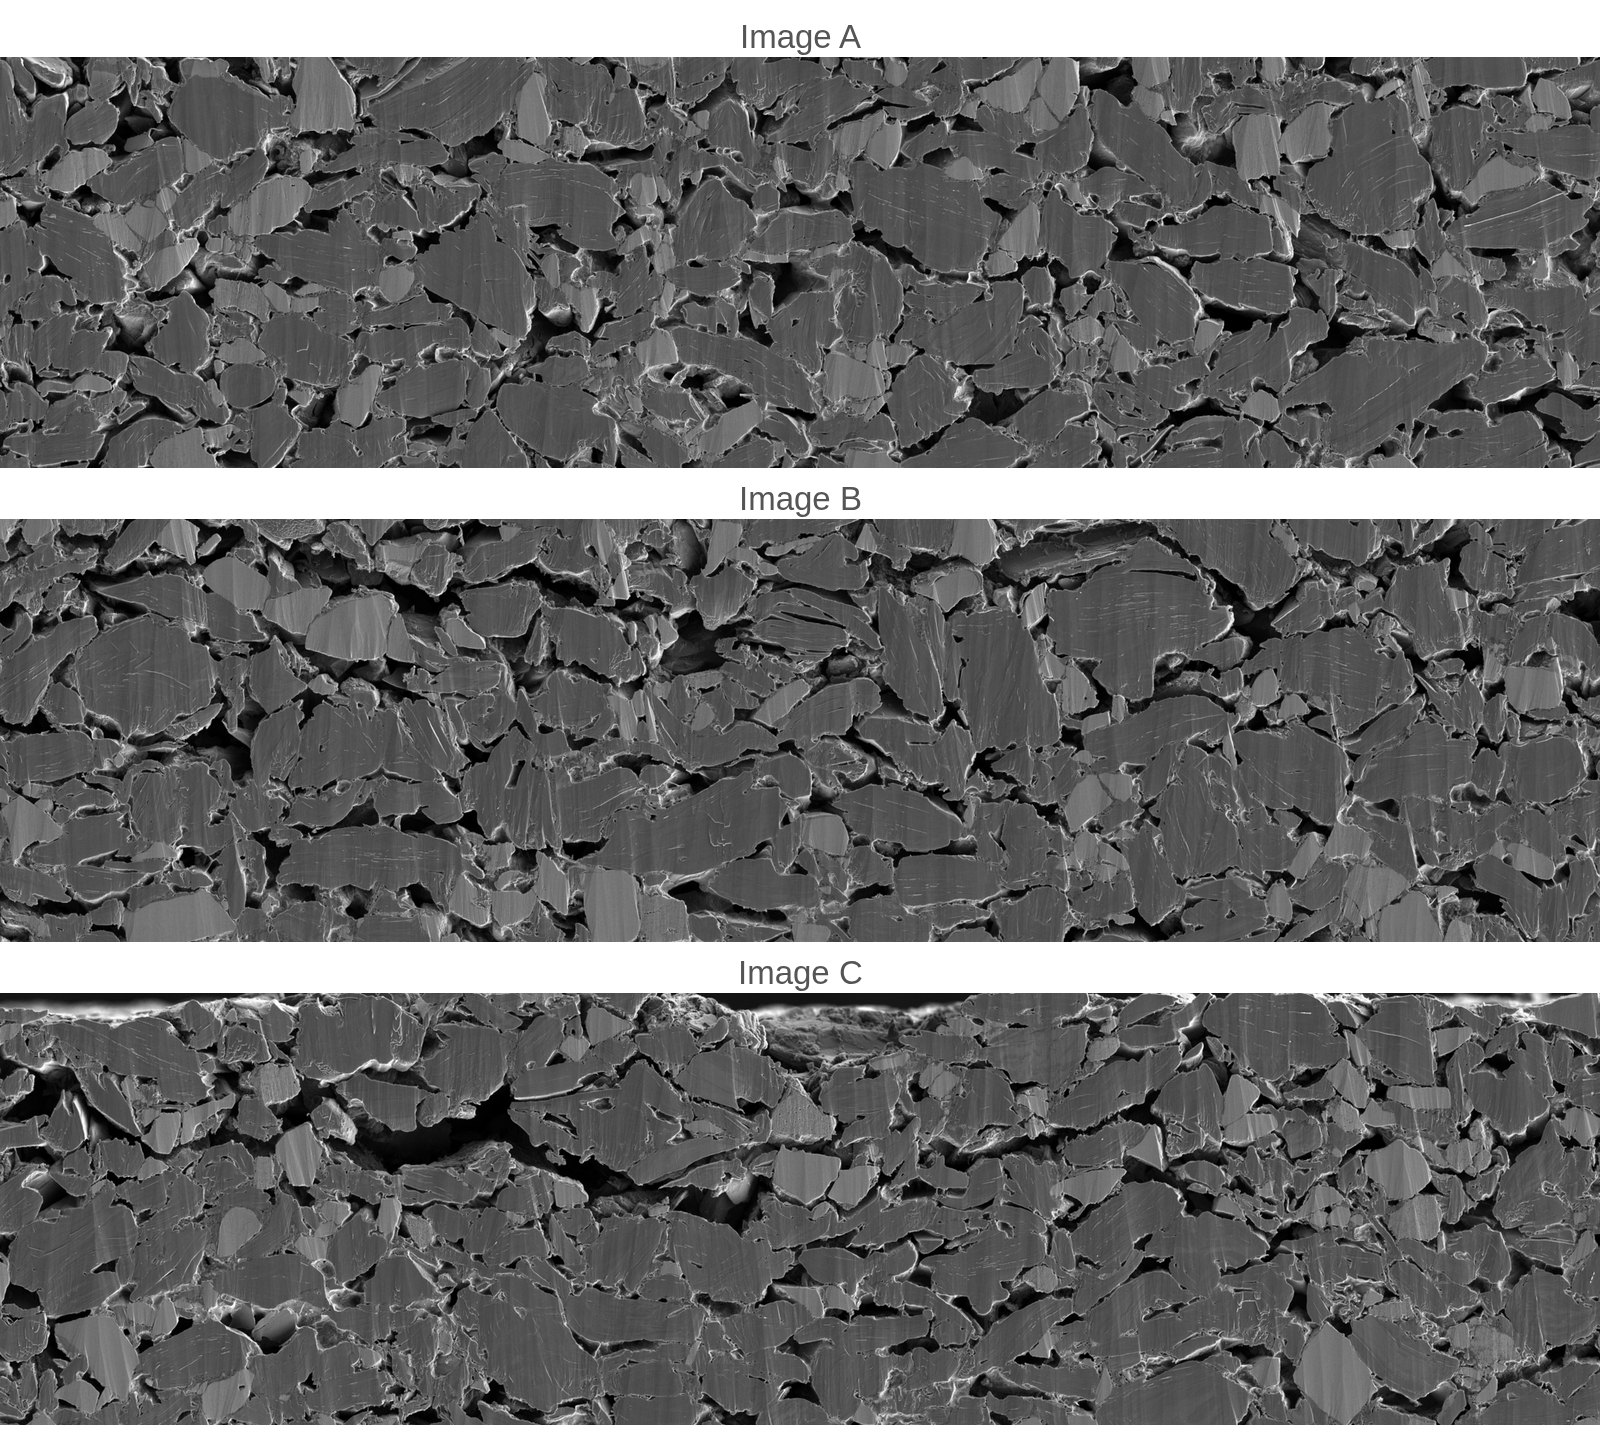
In this article, we explore how Polaron addresses this challenge using a dataset of cross-sectional SEM images of silicon anodes (Figure 1). Images A and B represent clean, healthy anode microstructures, while Image C contains a large crack and the surface of the anode near the top of the image. Using this dataset, we first demonstrate how conventional hold-out testing establishes segmentation accuracy, before showing why accuracy alone is insufficient for deployment on real manufacturing data. We then introduce Polaron's coherence metric, demonstrating how it identifies unfamiliar microstructures, predicts segmentation quality reliability without additional labels, and guides the selection of new annotations to improve model performance. Finally, we discuss how these concepts enable robust, scalable quality control across large imaging datasets by measuring not only what the model predicts, but also whether those predictions should be trusted.
Quantifying segmentation accuracy
The first step towards trustworthy microstructure quantification is establishing how accurately a segmentation model performs on data that contains features outside the training distribution. In machine learning, this is typically achieved using a train-test split. Rather than evaluating a model on the same annotations it was trained with, a proportion of expert labels is deliberately withheld. These held-out annotations are never exposed during training and instead provide an independent benchmark against which segmentation performance can be measured.
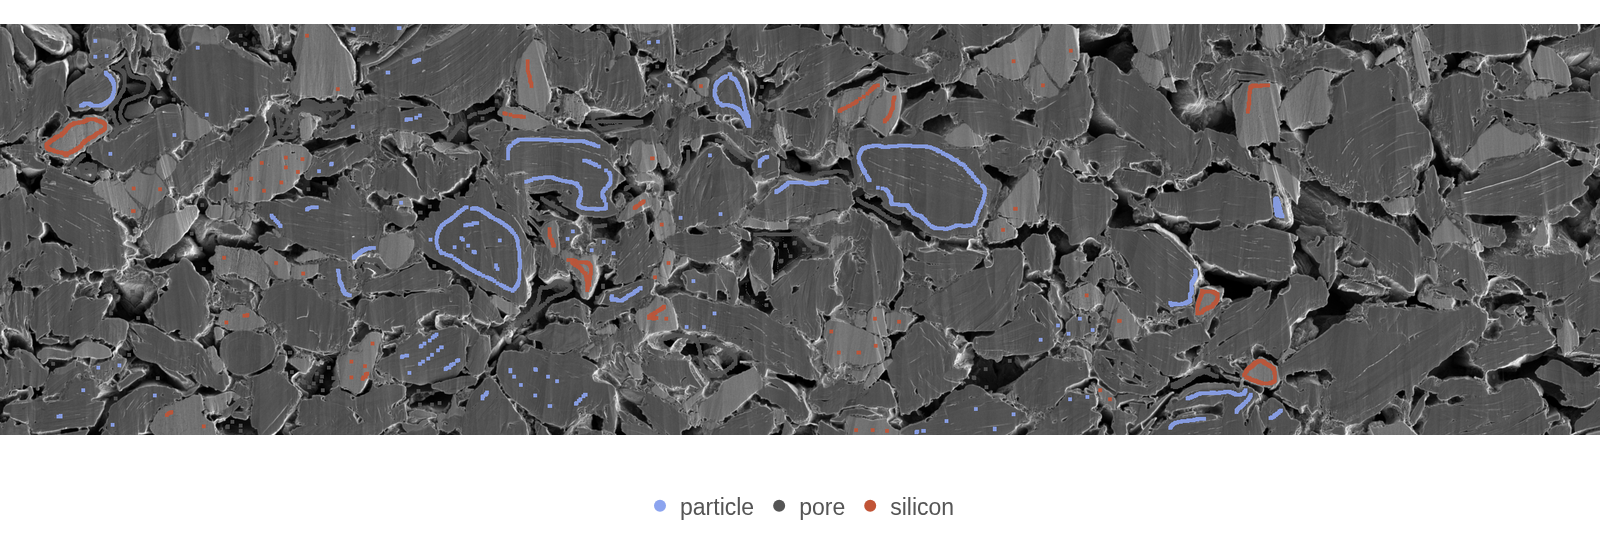
For the electrode dataset shown in Figure 1, expert brush annotations (Figure 2) were randomly divided into training and test sets. The training labels were used to train the segmentation model, while the remaining labels were reserved exclusively for evaluation. Performance was quantified using hold-out segmentation accuracy and Intersection over Union (IoU), providing an objective measure of how closely the predicted phase boundaries matched expert annotations.
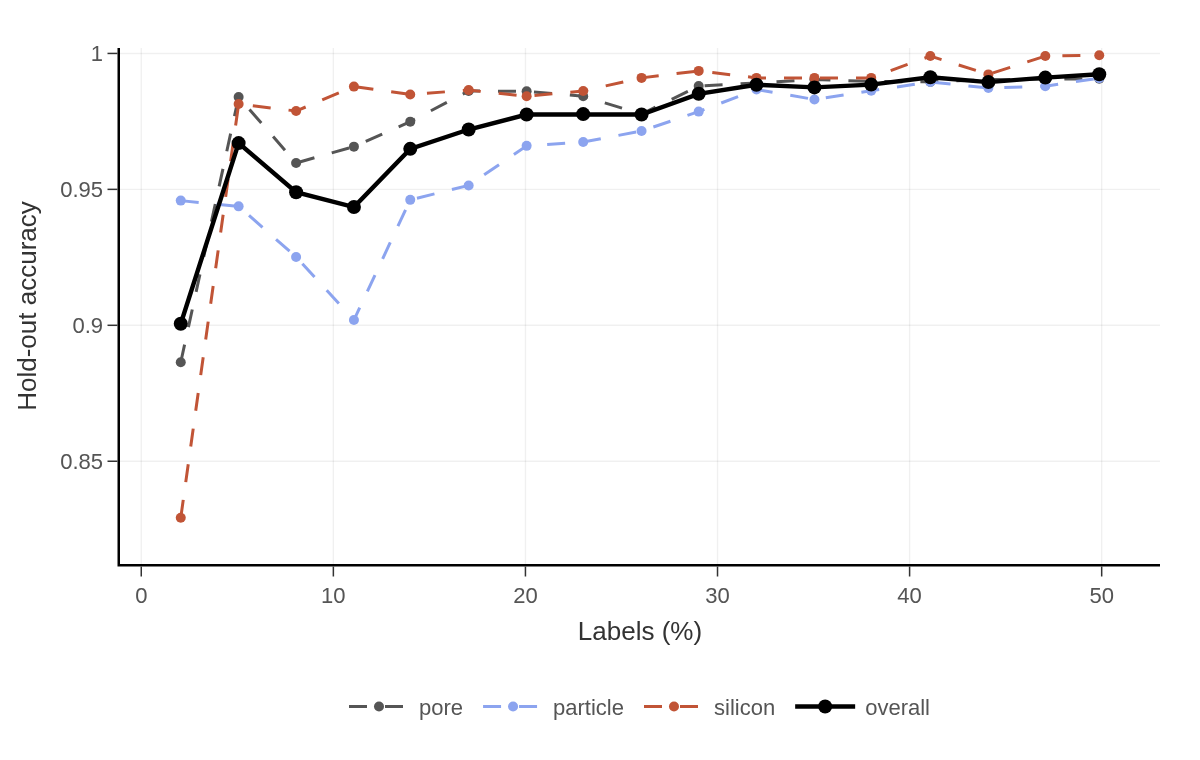
To understand how annotation effort translates into model performance, we repeated this process while progressively increasing the proportion of labelled pixels used for training. Figure 3 shows the resulting hold-out accuracy as additional expert labels become available. Rather than simply demonstrating that "more labels improve performance", the figure illustrates an important practical relationship: each additional annotation expands the model's understanding of the microstructure until diminishing returns are reached. Beyond approximately 25-30% of the available labels, accuracy begins to plateau, suggesting that the labelled dataset has captured most of the variation present within these images.
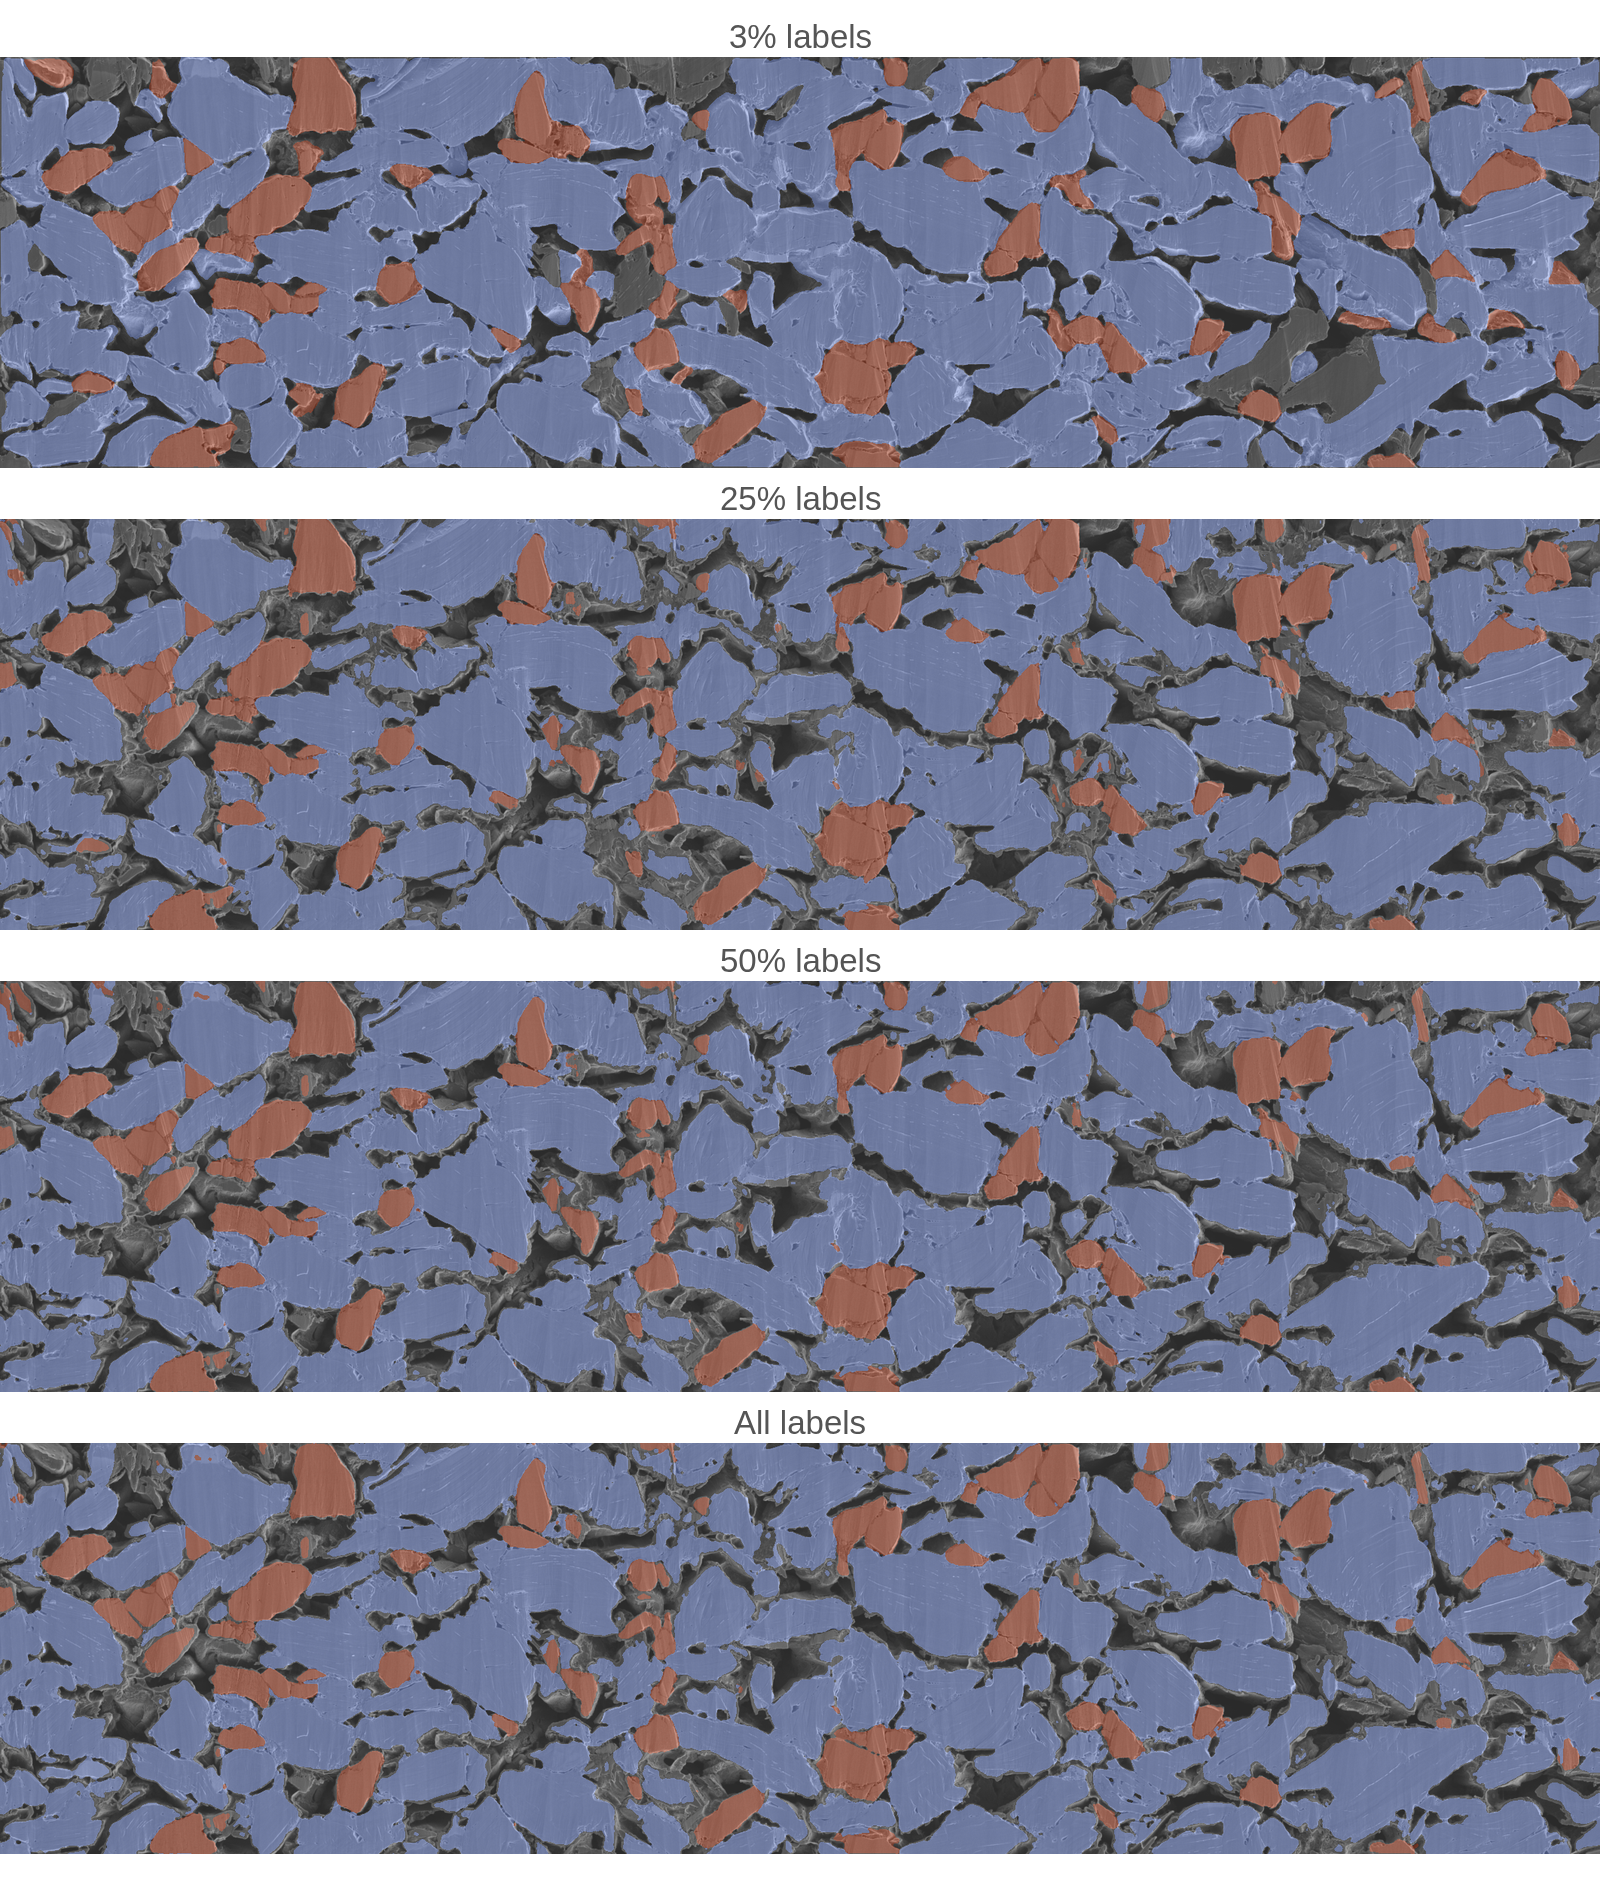
The corresponding segmentations are shown in Figure 4. Although the quantitative improvements continue beyond 25% labelling, the visual differences become increasingly subtle. The largest reduction in classification artefacts occurs between the sparsely labelled model and the 25% model, after which the predicted phase boundaries appear remarkably consistent. This highlights an important point for scientific imaging: qualitative inspection alone is often insufficient to judge model quality. Two segmentation masks may look almost identical, yet differ by enough pixels to influence measurements of porosity, silicon loading or particle size.
Hold-out evaluation therefore provides something that visual inspection alone cannot: an empirical estimate of segmentation accuracy against expert ground truth. However, it has an important limitation. These accuracy measurements are calculated using images drawn from the same dataset used to create the training labels. In materials science, this assumption rarely holds for long. Imaging conditions drift, sample preparation changes, and entirely new microstructures emerge during research or manufacturing.
This raises a more fundamental question. If an unfamiliar image entered a production batch—such as Image C, with its large crack and exposed anode surface—how would we know? Before comparing against expert annotations, how could we recognise that the model was operating outside the conditions on which its accuracy had been established, and that the segmentation could no longer be trusted? That challenge motivates the next stage of the workflow: measuring not just segmentation accuracy, but whether a new image is sufficiently representative of the data the model has previously seen.
Predicting performance on unseen data
Classical image similarity metrics such as the Structural Similarity Index Measure (SSIM) appear attractive solutions to the question of how similar a new image is to the training dataset, because they compare sets of images directly. However, they were designed to measure image fidelity rather than scientific meaning.
This distinction is important in electron microscopy. Small changes in stage position, image rotation, detector settings, brightness or contrast can substantially alter pixel values while leaving the underlying microstructure unchanged. Conversely, a physically significant feature such as a crack, delamination or exposed electrode surface may occupy only a small proportion of the image and therefore have little influence on a global similarity score, despite having a major impact on segmentation performance.
To address this limitation, Polaron has developed coherence, a microstructure-specific similarity metric designed to measure semantic rather than pixel-level similarity. Rather than comparing raw image intensities, coherence draws on deep feature representations learned from large-scale visual data and evaluates whether local material and global appearances are consistent with those observed in the expert-labelled training set. The result is a measure of representivity that reflects how familiar an image is to the segmentation model, rather than how closely its pixels resemble a reference image.
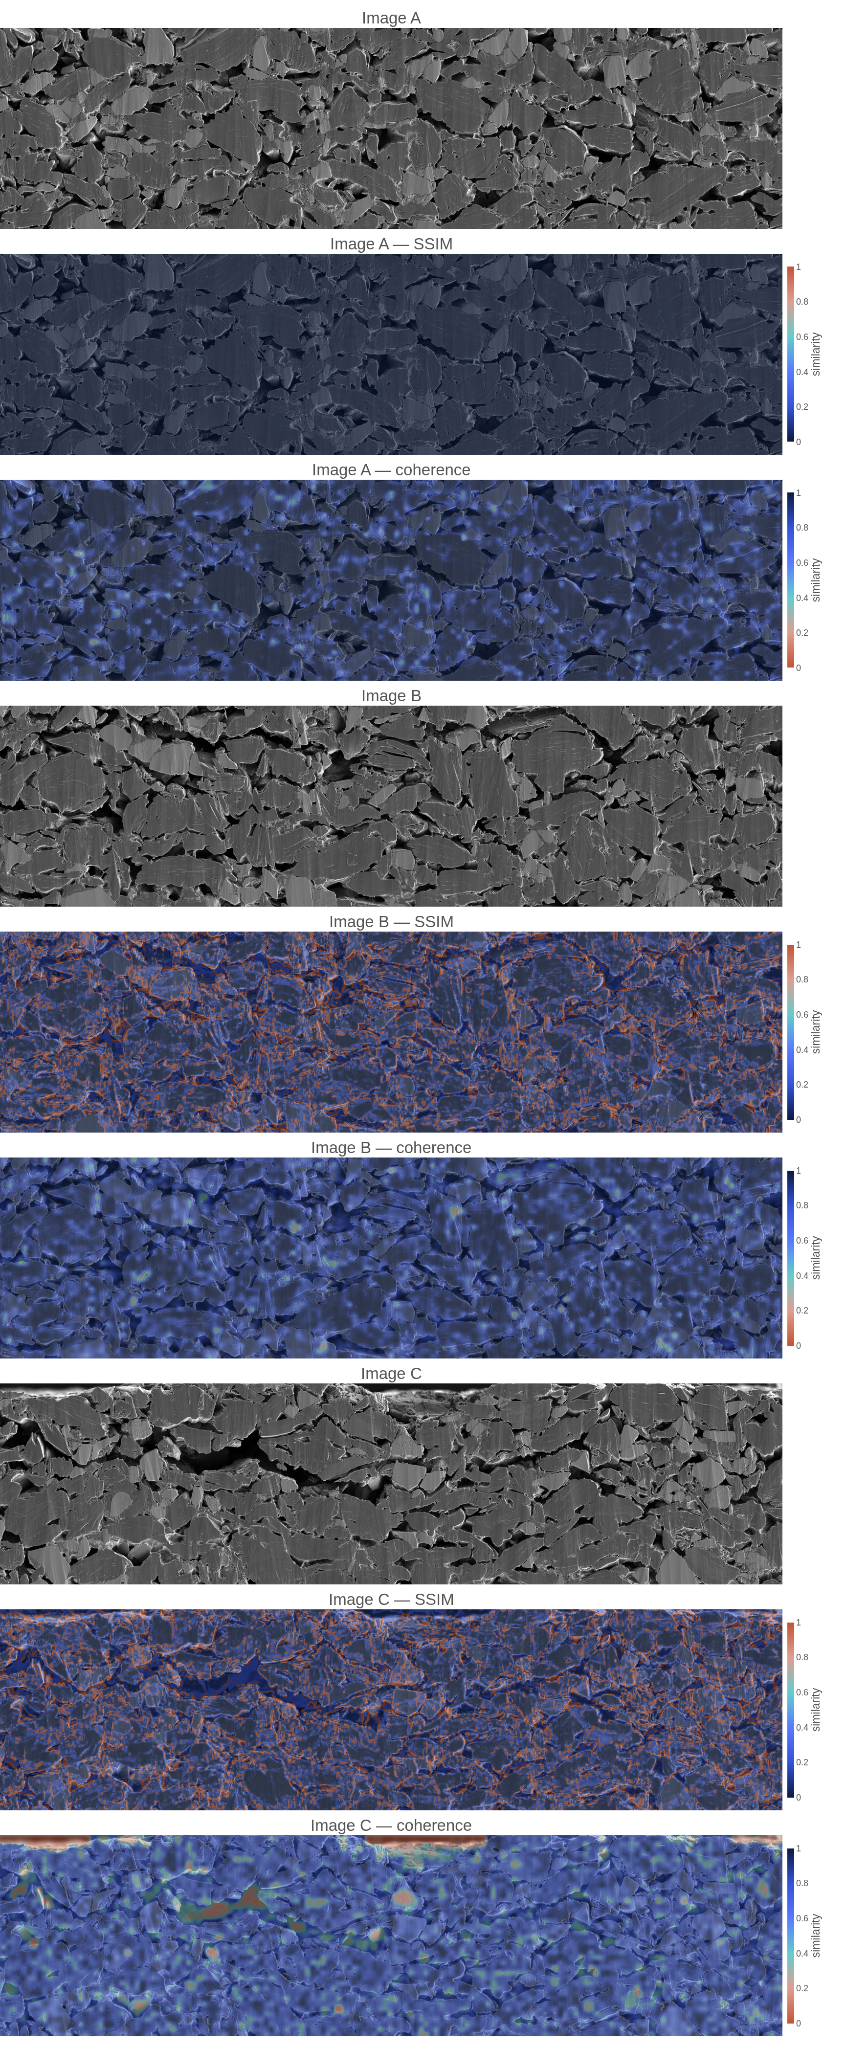
Figure 5 illustrates this behaviour. The SSIM maps largely respond to pixel-level differences between images, whereas the Polaron coherence maps identify regions whose appearance is genuinely unfamiliar to the segmentation model. For Images A and B, coherence remains high across almost the entire field of view because their local microstructures resemble the labelled training data. In contrast, Image C contains a large crack and exposed anode surface that were absent from the labelled examples. These regions are immediately highlighted as low-coherence despite occupying only part of the image, providing a semantic measure of outlying features rather than simple pixel similarity.
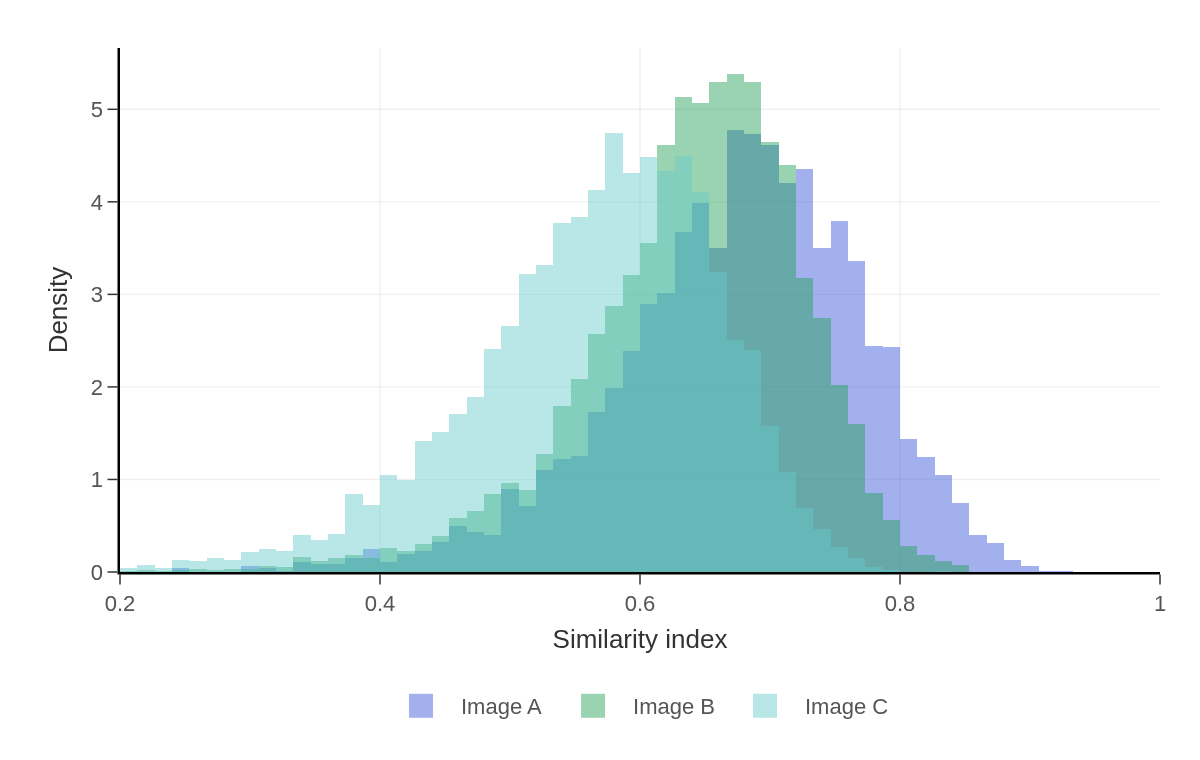
To further explore this observation, the coherence values can be summarised across every pixel in each image. Figure 6 shows the resulting coherence distributions for Images A-C using Polaron’s approach. Images A and B produce similar distributions because their appearance lies comfortably within the labelled training data. Image C, however, exhibits a clear shift towards lower coherence values, reflecting the presence of microstructural features that the model has not previously encountered. Importantly, this warning is generated without requiring additional expert annotations. Rather than waiting until segmentation errors have been visually identified, coherence provides an early indication that the model is operating outside the conditions under which its performance was validated. This allows users to find outliers amongst thousands of images.
Coherence and model generalisation
A useful uncertainty metric should do more than identify outliers; it should predict when segmentation performance is likely to degrade before ground truth is available. To investigate this relationship, we systematically altered the contrast of the SEM images while keeping the underlying microstructure unchanged. Contrast variation is common in production imaging due to differences in detector settings, sample preparation and microscope operating conditions, making it a realistic test of model robustness.
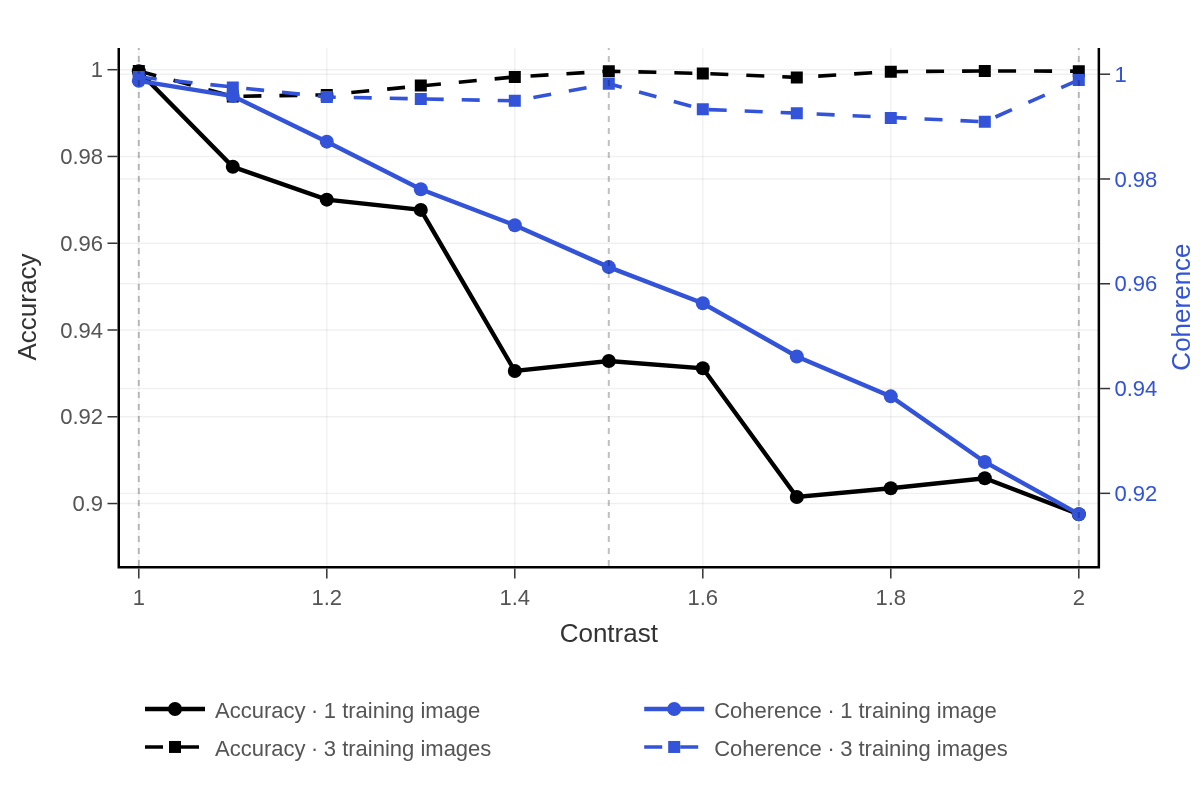
The solid curves in Figure 7 correspond to a model trained using labels from a single image appearance. As image contrast progressively deviates from the training conditions, segmentation accuracy falls steadily. Importantly, the coherence score follows the same trend. Without the use of additional labels on new images, coherence correctly predicts that the model is moving further away from the appearance distribution represented within the training data.
We then repeated the experiment after expanding the training set to include three representative image appearances with contrast values of 1.0, 1.5 and 2.0, shown in Figure 8. Both segmentation accuracy and coherence now remain consistently high across the full range of image contrasts because the model has learned a broader description of the underlying material, with robustness to contrast variation.
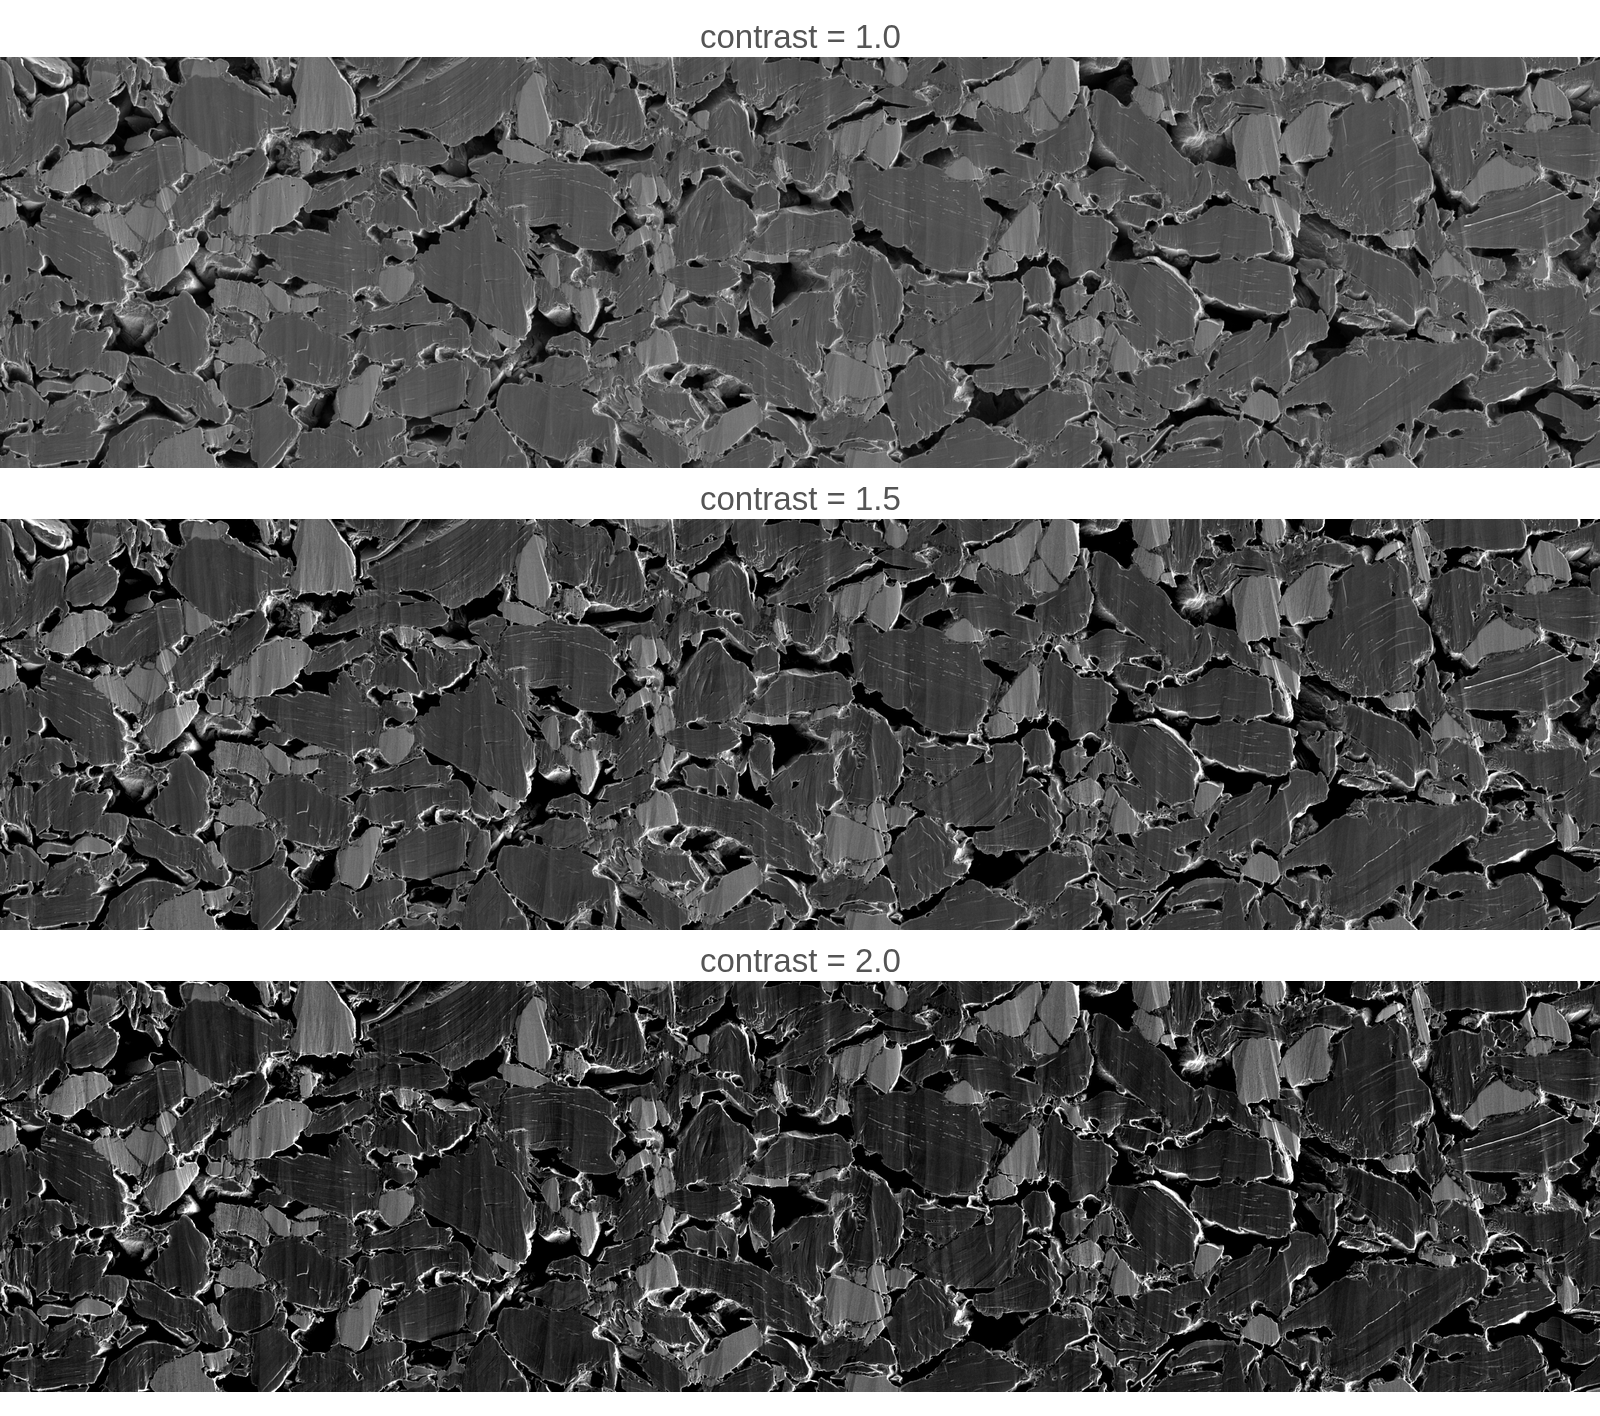
This illustrates an important distinction. Improving segmentation performance is not simply a matter of drawing more labels. What matters is representative labels—examples that capture the natural variability encountered during imaging. By increasing the diversity of the labelled training set, the feature-space representation becomes more complete, allowing the model to generalise confidently across changing acquisition conditions while maintaining a reliable estimate of its own uncertainty.
When an engineer asks, "Is my segmentation model robust to contrast variation?", the answer ultimately depends on whether that variation is represented within the training data. If a new image lies outside the distribution of previously observed appearances, the model has no empirical basis on which to guarantee its predictions. Any segmentation produced under those conditions is necessarily an extrapolation rather than a validated interpolation. Coherence does not eliminate this uncertainty, but it makes it measurable: it identifies when an image has moved beyond the model's demonstrated operating regime and indicates where additional representative annotations are required. Rather than presenting every prediction with equal confidence, the workflow distinguishes between measurements that are supported by evidence and those that require further labelling before their uncertainty can be meaningfully quantified.
From Individual Images to Production Workflows
The practical value of coherence becomes apparent once segmentation moves beyond individual research images. Manufacturing and characterisation pipelines routinely generate thousands of SEM images, making manual inspection of every segmentation impractical. While hold-out accuracy establishes how well a model performs on representative labelled data, it provides no indication of which images within a new batch are likely to violate those assumptions.
Coherence fills this gap. Because it requires no additional annotations, every image in a dataset can be ranked according to its expected segmentation reliability before quantitative measurements are reported. Images with unusually low coherence can be prioritised for expert review, while clusters of low-coherence images provide an early indication of process drift, changing acquisition conditions or genuinely novel microstructures.
Perhaps more importantly, coherence also provides guidance for improving the model itself. Rather than requesting additional labels at random, engineers can focus annotation effort on the regions and images that contribute least to the existing feature-space representation. Each new representative example expands the model's understanding of the material system, increasing both segmentation performance and confidence across future datasets. In this way, coherence becomes not only a measure of uncertainty, but also a roadmap for building more representative and more generalisable segmentation models.
Conclusion
Accurate segmentation is only the first step towards quantitative microstructure analysis. For scientific measurements such as porosity, particle size, crack density or active material fraction, the more important question is whether those measurements can be trusted.
Hold-out evaluation provides an objective measure of segmentation accuracy, but only for images that are representative of the labelled dataset. Coherence extends this assessment to previously unseen images by identifying when their appearance falls outside the model's existing experience. Combined with representative training data, it enables reliable prediction of segmentation performance without requiring new ground-truth labels for every image.
This capability becomes increasingly valuable as datasets grow from tens of images to thousands. Instead of treating every segmentation equally, engineers can identify outliers, monitor process drift, prioritise expert review and target new annotations where they will have the greatest impact. The result is a workflow that continually improves as new representative data become available while maintaining visibility of the uncertainty associated with every prediction.
At Polaron, segmentation is not the end product. The goal is reliable, quantitative microstructure measurements with a transparent understanding of when those measurements can, and cannot, be trusted.